

The figures, from Public Health England, show which neighbourhoods saw a decrease in cases for the seven days to November 17, 2020.
Seven–day rates are expressed per 100,000 population and are calculated by dividing the seven day count by the area population and multiplying by 100,000.
Please note that the images used for illustrative purposes only and not linked to the data.
Below are all the areas in Fylde and Wyre that saw a drop in cases, listed from lowest to highest percentage decrease.
Please note that the images used for illustrative purposes only and not linked to the data.
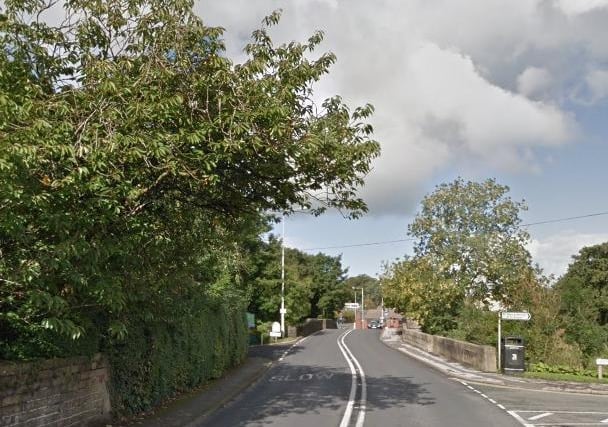
13. Bonds, Bilsborrow & Wyresdale - 47.1% drop in cases
There were 9 cases recorded in Bonds, Bilsborrow & Wyresdale, down 47.1%. The current rolling case rate is 131.0 which is below the national average. Photo: Google
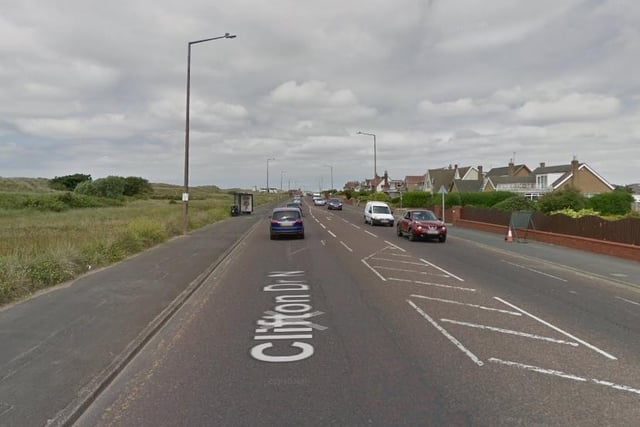
14. St Annes North & Airport
There were 11 cases recorded in St Annes North & Airport, down 54.2%. The current rolling case rate is 149.7 which is below the national average. Photo: Google
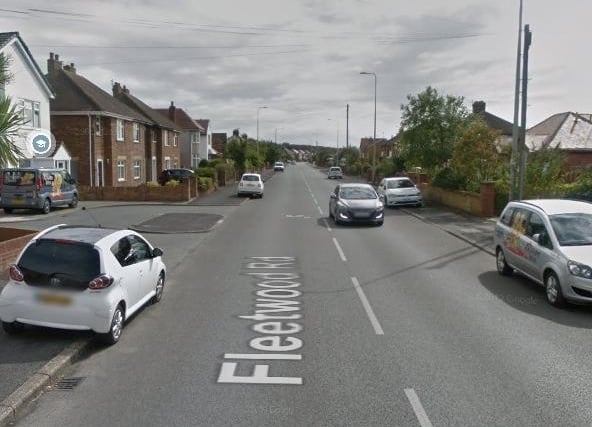
15. Fleetwood South East - 54.5% drop in cases
There were 10 cases recorded in Fleetwood South East, down 54.5%. The current rolling case rate is 133.2 which is below the national average. Photo: Google
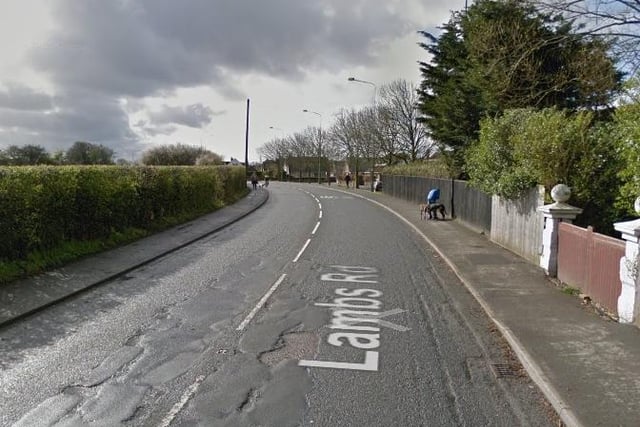
16. Thornton East & Carleton West
There were 9 cases recorded in Thornton East & Carleton West, down 64%. The current rolling case rate is 98.3 which is below the national average. Photo: Google